Multiple Choice
Solve the problem.
-The data below represent the average monthly cost of natural gas in an Oregon home. 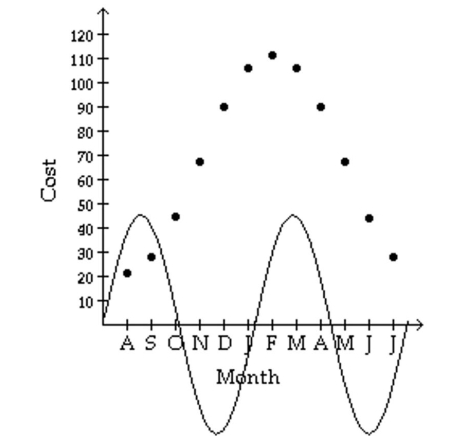
Above is the graph of superimposed over a scatter diagram of the data. Find the sinusoidal function o form which best fits the data.
A)
B)
C)
D)
Correct Answer:

Verified
Correct Answer:
Verified
Q100: Graph the function. Show at least
Q101: Convert the angle in radians to
Q102: Use the even-odd properties to find
Q103: Find the phase shift of the
Q104: Draw the angle.<br>- <span class="ql-formula" data-value="-
Q106: Graph the function.<br>- <span class="ql-formula" data-value="y
Q108: Solve the problem.<br>-An irrigation sprinkler in
Q109: Write the equation of a sine
Q110: Without graphing the function, determine its
Q280: Solve the problem.<br>-A pick-up truck is fitted