Essay
Solve the problem.
-The data below represent the average monthly cost of natural gas in an Oregon home. 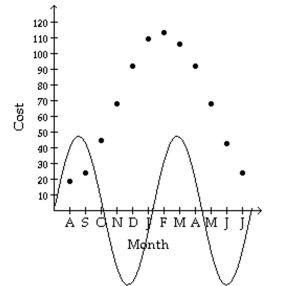 Above is the graph of ake a scatter diagram of the data. Find the sinusoidal function of the form which fits the data.
Correct Answer:

Verified

\[\begin{array} { c }
y = 4 ...View Answer
Unlock this answer now
Get Access to more Verified Answers free of charge
Correct Answer:
Verified
\[\begin{array} { c }
y = 4 ...
View Answer
Unlock this answer now
Get Access to more Verified Answers free of charge
Q13: Solve the problem.<br>- <span class="ql-formula" data-value="\sin
Q14: Find the exact value of the
Q15: Find the length s. Round the
Q16: Use a calculator to find the
Q17: Find an equation for the graph.<br>-<img
Q19: Without graphing the function, determine its
Q20: Name the quadrant in which the
Q21: Match the given function to its
Q22: Solve the problem.<br>-The following data represents
Q23: Name the quadrant in which the