Essay
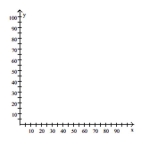
Plot and interpret the appropriate scatter diagram.
-The one-day temperatures for 12 world cities along with their latitudes are shown in the table below. Make a
scatter diagram for the data. Describe what happens to the one-day temperatures as the latitude increases. Latitude (degrees)  Temperature (F)°
Correct Answer:

Verified


Temperature (F)°
...View Answer
Unlock this answer now
Get Access to more Verified Answers free of charge
Correct Answer:
Verified
Temperature (F)°
...
View Answer
Unlock this answer now
Get Access to more Verified Answers free of charge
Q15: Solve the problem.<br>-The quadratic function
Q16: Use factoring to find the zeros
Q17: Graph the function using its vertex,
Q18: Solve the equation.<br>- <span class="ql-formula" data-value="\left|
Q20: Use factoring to find the zeros
Q21: Solve the problem.<br>-Consider the quadratic model
Q22: Determine where the function is increasing
Q23: Graph the function. State whether it
Q210: Solve the problem.<br>-A lumber yard has fixed
Q289: Write the word or phrase that best