Multiple Choice
Solve the problem.
-The following scatter diagram shows heights (in inches) of children and their ages. 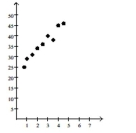
Age (years) Based on this data, how old do you think a child is who is about 39 inches tall?
A) 3 months
B) 1 year
C) 3 years
D) 7 years
Correct Answer:

Verified
Correct Answer:
Verified
Related Questions
Q99: Determine the slope and y-intercept of the
Q162: Solve the inequality. Express your answer
Q163: Graph the function using its vertex,
Q164: Determine, without graphing, whether the given
Q165: Solve the problem.<br>-As part of a
Q167: Determine where the function is increasing
Q168: Graph the function f by starting
Q169: Solve the problem.<br>-The price p and
Q170: Plot and interpret the appropriate scatter
Q171: Find the complex zeros of the