Essay
Solve the problem.
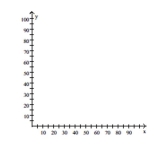
-The one-day temperatures for 12 world cities along with their latitudes are shown in the table below. Make a
scatter diagram for the data. Then find the line of best fit and graph it on the scatter diagram. Latitude (degrees)  Temperature (F)°
Correct Answer:

Verified


Temperature (F)°...View Answer
Unlock this answer now
Get Access to more Verified Answers free of charge
Correct Answer:
Verified
Temperature (F)°...
View Answer
Unlock this answer now
Get Access to more Verified Answers free of charge
Q58: Solve the problem.<br>-Suppose that <span
Q59: Match the graph to one of
Q60: Solve the equation.<br>- <span class="ql-formula" data-value="|
Q61: Find the zeros of the quadratic
Q62: Solve the problem.<br>-Alan is building a
Q64: Solve the inequality.<br>- <span class="ql-formula" data-value="x
Q66: Find the real zeros, if any,
Q67: Solve the inequality.<br>- <span class="ql-formula" data-value="x
Q68: Determine the domain and the range
Q219: Solve the problem.<br>-Suppose that the quantity supplied