Multiple Choice
The following graph shows the populations of the metropolitan areas of City X and City Y over six years. 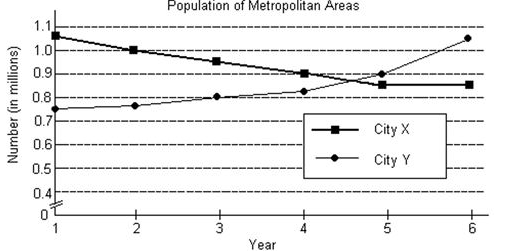
-At the time when the populations of the two metropolitan areas were equal, what was the approximate population of each area?
A) about 0.95 million
B) about 0.87 million
C) about 0.92 million
D) about 1.03 million
Correct Answer:

Verified
Correct Answer:
Verified
Q160: Graph the inequality.<br>- <span class="ql-formula" data-value="3
Q161: Solve the system.<br>- <span class="ql-formula" data-value="\begin{array}
Q162: Use a graphing calculator and the
Q163: Find the partial fraction decomposition for
Q164: Decide whether or not the matrices
Q166: Decide whether or not the matrices
Q167: Use a graphing calculator to find
Q168: Graph the solution set of the system
Q169: Find the value of the determinant.<br>-
Q170: Find the partial fraction decomposition for