Multiple Choice
The graph shows the region of feasible solutions. Find the maximum or minimum value, as specified, of the objective
function.
-objective function ; minimum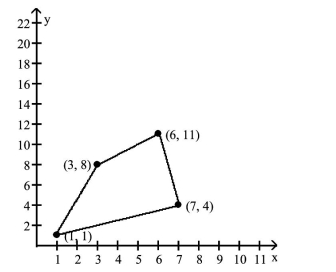
A)
B)
C)
D)
Correct Answer:

Verified
Correct Answer:
Verified
Related Questions
Q435: Solve the system for x and
Q436: Graph the solution set of the system
Q437: Use Cramerʹs rule to solve the
Q438: Use the shading capabilities of your
Q439: Decide whether or not the matrices
Q441: Solve the problem.<br>-Caroleʹs car averages 12.9 mi/gal
Q442: Solve the system. If the system
Q443: Use the Gauss-Jordan method to solve
Q444: Which method should be used to
Q445: Write the system of equations associated