Multiple Choice
The graph shows the region of feasible solutions. Find the maximum or minimum value, as specified, of the objective
function.
-objective function maximum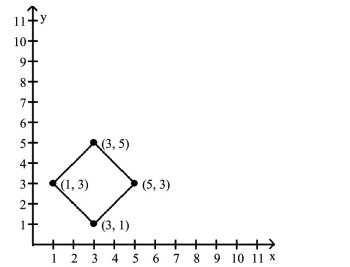
A) 13
B) 100
C) 29
D) 27
Correct Answer:

Verified
Correct Answer:
Verified
Q235: Evaluate the determinant.<br>- <span class="ql-formula" data-value="\left|
Q236: Graph the inequality.<br>- <span class="ql-formula" data-value="y
Q237: Find the inverse, if it exists,
Q238: Graph the solution set of the system
Q239: Provide an appropriate response.<br>-Which of the
Q241: Write the augmented matrix for the
Q242: Solve the system.<br>- <span class="ql-formula" data-value="\begin{array}
Q243: Graph the inequality.<br>- <span class="ql-formula" data-value="y
Q244: Find the value of the determinant.<br>-
Q245: Find the values of the variables