Multiple Choice
The graph shows the region of feasible solutions. Find the maximum or minimum value, as specified, of the objective
function.
-objective function minimum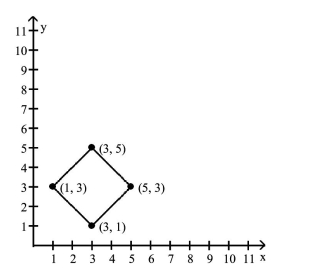
A) 36
B) 0
C) 24
D) 16
Correct Answer:

Verified
Correct Answer:
Verified
Related Questions
Q179: If the graphs of a system of
Q297: Graph the inequality.<br>- <span class="ql-formula" data-value="y
Q298: Graph the solution set of the
Q299: Use a graphing calculator to find
Q300: Solve the problem using matrices.<br>-John has
Q301: Solve the problem.<br>-Find the dimensions of
Q304: Find the partial fraction decomposition for
Q305: Find the values of the variables
Q306: A nonlinear system is given, along
Q307: Perform the operation or operations when