Multiple Choice
Solve the problem.
-The chart represents the amount of fuel consumed by a machine used in manufacturing. The machine is turned on at the beginning of the day, takes a certain amount of time to reach its full power (the point at which it uses the most fuel per hour) , runs for a certain number of hours, and is shut off at the end of the work day. The fuel usage per hour of the machine is represented by a periodic function. When does the machine first reach its full power?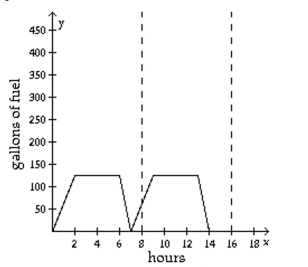
A) After 2 hours
B) After 14 hours
C) After 4 hours
D) After 7 hours
Correct Answer:

Verified
Correct Answer:
Verified
Q197: Graph the function.<br>- <span class="ql-formula" data-value="y
Q198: The figure shows an angle θ
Q199: The function graphed is of the
Q200: Give the amplitude or period as
Q201: Solve the problem.<br>-Suppose that a weight
Q203: Graph the function.<br>- <span class="ql-formula" data-value="y=\frac{2}{3}
Q204: Solve the problem.<br>-A pendulum swinging through
Q205: Solve the problem.<br>-A weight attached to
Q206: Graph the function.<br>- <span class="ql-formula" data-value="y=\frac{1}{2}
Q207: Graph the function.<br>- <span class="ql-formula" data-value="y=-\frac{1}{2}