Multiple Choice
Find the average rate of change illustrated in the graph.
-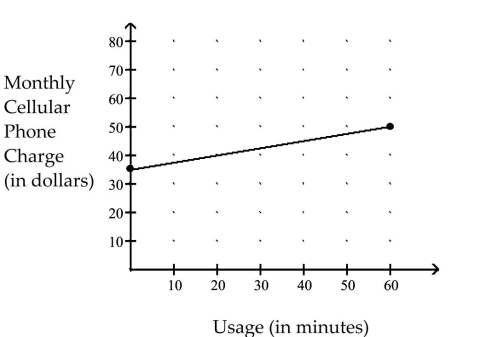
A) per minute
B) per minute
C) per minute
D) per minute
Correct Answer:

Verified
Correct Answer:
Verified
Related Questions
Q360: Consider the function h as defined.
Q361: Evaluate the function.<br>-Find <span class="ql-formula"
Q362: Describe how the graph of the
Q363: Graph the line described.<br>-through <span
Q364: Graph the function.<br>- <span class="ql-formula" data-value="f(x)=\llbracket
Q366: Decide whether the relation defines a
Q367: Determine the intervals of the domain
Q368: Use a graphing calculator to solve
Q369: Graph the function.<br>- <span class="ql-formula" data-value="y=\sqrt{x-5}"><span
Q370: For the given functions f and