Multiple Choice
Find the average rate of change illustrated in the graph.
-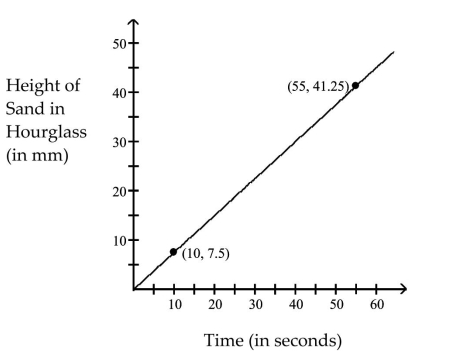
A) per second
B) per second
C) per second
D) per second
Correct Answer:

Verified
Correct Answer:
Verified
Related Questions
Q9: Give a rule for the piecewise-defined
Q10: Give the domain and range of
Q11: Graph the function.<br>- <span class="ql-formula" data-value="y
Q12: Match the equation with the correct
Q13: Solve the problem. Write all linear
Q15: Graph the linear function and give
Q16: Evaluate the function.<br>-Find <span class="ql-formula"
Q17: Solve the problem.<br>-Find all points
Q18: Graph the line and give the
Q19: Find the slope of the line