Multiple Choice
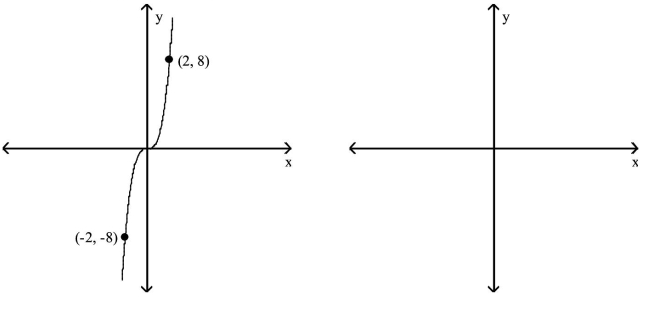
The figure below shows the graph of a function y = f(x) . Use this graph to solve the problem.
- 
A) 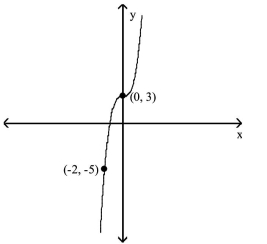
B) 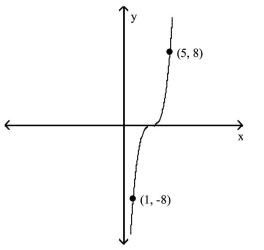
C) 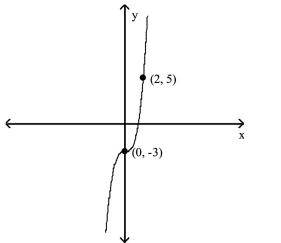
D) 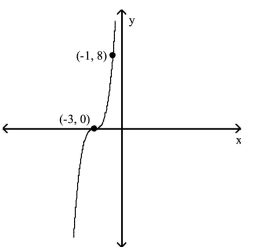
Correct Answer:

Verified
Correct Answer:
Verified
Related Questions
Q144: Determine whether the equation has a
Q145: Decide whether the relation defines a
Q146: Use the graph to solve the
Q147: Match the equation with the correct
Q148: Find the coordinates of the other endpoint
Q150: Graph the function.<br>- <span class="ql-formula" data-value="h
Q151: Find the slope of the line
Q152: Find the requested value.<br>- <span class="ql-formula"
Q153: Find the slope of the line
Q154: Find the slope of the line