Multiple Choice
A new chocolate company is estimating how many candy bars per week college students will consume of their line of
products. The graph shows the probable number of candy bars students (age 18 -22) will consume from year 0 to year 10.
B(x) gives the number of candy bars for boys, G(x) gives the number of candy bars for girls, and T(x) gives the total
number for both groups. Use the graph to answer the question. 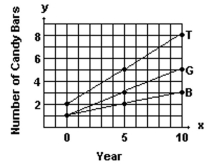
-Estimate B(7) and G(7) and use your estimates to estimate T(7) .
A) 2.3; 4.0; 6.3
B) 3.5; 4.2; 7.7
C) 2.5; 4.0; 6.5
D) 2.2; 4.3; 6.5
Correct Answer:

Verified
Correct Answer:
Verified
Q448: Give the domain and range of
Q449: Solve the problem.<br>-Find the equation of
Q450: Decide whether the relation defines a function.<br>-{(-8,
Q451: Solve the problem.<br>-Suppose a life insurance policy
Q452: Provide an appropriate response.<br>-If the point
Q454: Solve the problem. Write all linear
Q455: Determine whether the three points are the
Q456: Find the requested value.<br>-Using the given
Q457: Graph the line and give the
Q458: Write an equation for the line