Essay
The accompanying Venn diagram describes the sample space of a particular experiment
and events A and B. Suppose the sample points are equally likely. Find P(A)and P(B). 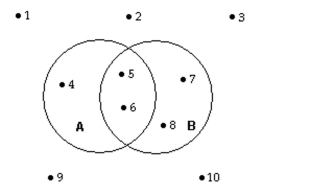
Correct Answer:

Verified
Correct Answer:
Verified
Related Questions
Q7: The data below show the types
Q8: In a box of 50 markers, 30
Q9: An exit poll during a recent election
Q10: Evaluate<br> <span class="ql-formula" data-value="\left( \begin{array} {
Q11: If every sample point in event
Q13: An experiment consists of randomly choosing a
Q14: Each manager of a corporation was
Q15: Find the numerical value.<br>-A panel of
Q16: In any experiment with exactly four sample
Q17: Find the numerical value.<br>- <span class="ql-formula"