Multiple Choice
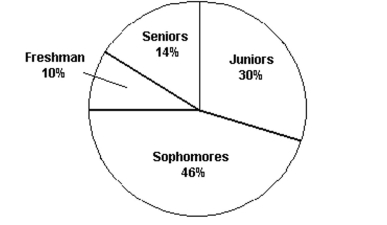 The pie chart shows the classifications of students in a statistics class. What percentage of the class consists of freshman, sophomores, and juniors?
A) 54%
B) 44%
C) 86%
D) 14%
Correct Answer:

Verified
Correct Answer:
Verified
Related Questions
Q22: The mean <span class="ql-formula" data-value="\bar
Q23: Which of the following is a measure
Q24: The bars in a histogram should be
Q25: The process for finding a percentile is
Q26: A shoe company reports the mode for
Q28: An outlier in a data set may
Q29: Chebyshevʹs rule applies to qualitative data sets,
Q30: Which of the graphical techniques below can
Q31: A sample of 100 e-mail users were
Q32: A study was designed to investigate the