Multiple Choice
A dot plot of the speeds of a sample of 50 cars passing a policeman with a radar gun is shown below. 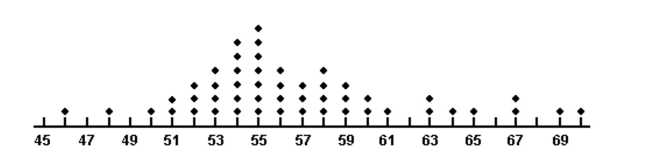 What proportion of the motorists were driving above the posted speed limit of 55 miles per hour?
A) 0.14
B) 7
C) 0.50
D) 0.64
Correct Answer:

Verified
Correct Answer:
Verified
Related Questions
Q166: The range is an insensitive measure of
Q167: The amount spent on textbooks for the
Q168: Box plots are used to detect outliers
Q169: Explain how using a scale break on
Q170: According to the empirical rule, z-scores of
Q172: The amount of television viewed by todayʹs
Q173: The amount spent on textbooks for the
Q174: Which is expressed in the same units
Q175: Many firms use on-the-job training to teach
Q176: The top speeds for a sample of