Multiple Choice
The box plot shown below displays the amount of soda that was poured by a filling machine into 12-ounce soda cans at a local bottling company. 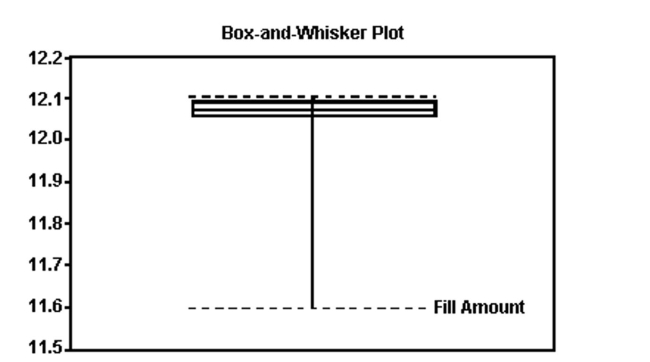 Based on the box plot, what shape do you believe the distribution of the data to have?
A) approximately symmetric
B) skewed to the left
C) skewed to the right
D) skewed to the center
Correct Answer:

Verified
Correct Answer:
Verified
Q137: Many firms use on-the-job training to teach
Q138: Parking at a university has become a
Q139: In an eye color study, 25 out
Q140: <img src="https://d2lvgg3v3hfg70.cloudfront.net/TB34225555/.jpg" alt=" The
Q141: The amount of time workers spend commuting
Q143: In symmetric distributions, the mean and the
Q144: The test scores of 30 students
Q145: A larger standard deviation means greater variability
Q146: What number is missing from the
Q147: A sociologist recently conducted a survey