Multiple Choice
The box plot shown below was constructed for the amount of soda that was poured by a filling machine into 12-ounce soda cans at a local soda bottling company. 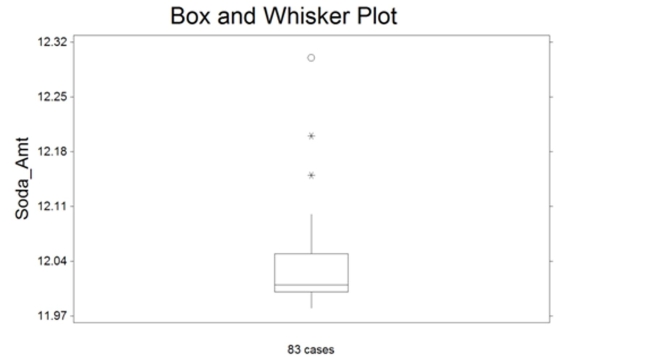 We see that one soda can received 12.15 ounces of soda on the plot above. Based on the box plot
Presented, how would you classify this observation?
A) highly suspect outlier
B) it has a lot of soda
C) suspect outlier
D) expected observation
Correct Answer:

Verified
Correct Answer:
Verified
Q41: The calculator screens summarize a data set.
Q42: The amount spent on textbooks for the
Q43: A survey was conducted to determine
Q44: A recent survey was conducted to compare
Q45: In a distribution that is skewed to
Q47: A recent survey was conducted to compare
Q48: At the U.S. Open Tennis Championship a
Q49: During one recent year, U.S. consumers redeemed
Q50: In general, the sample mean is a
Q51: Each year advertisers spend billions of