Multiple Choice
The box plot shown below was constructed for the amount of soda that was poured by a filling machine into 12-ounce soda cans at a local soda bottling company. 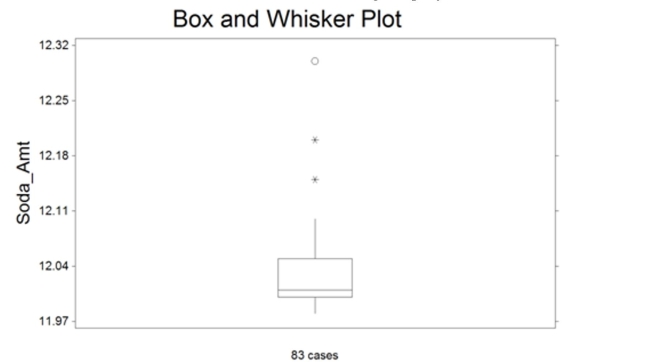 We see that one soda can received 12.30 ounces of soda on the plot above. Based on the box plot
Presented, how would you classify this observation?
A) suspect outlier
B) expected observation
C) it has a lot of soda
D) highly suspect outlier
Correct Answer:

Verified
Correct Answer:
Verified
Q130: The calculator screens summarize a data set.
Q131: What number is missing from the table?
Q132: On a given day, the price of
Q133: By law, a box of cereal labeled
Q134: Which of the following is a measure
Q136: For a given data set, the lower
Q137: Many firms use on-the-job training to teach
Q138: Parking at a university has become a
Q139: In an eye color study, 25 out
Q140: <img src="https://d2lvgg3v3hfg70.cloudfront.net/TB34225555/.jpg" alt=" The