Multiple Choice
The contingency table below shows the results of a random sample of 200 state representatives that was conducted to see whether their opinions on a bill are related to their party affiliations.
Assuming the row and column classifications are independent, find an estimate for the expected cell count .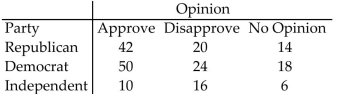
A)
B)
C)
D)
Correct Answer:

Verified
Correct Answer:
Verified
Q8: A coffeehouse wishes to see if
Q9: Use the appropriate table to find
Q10: The contingency table below shows the
Q11: Find the rejection region for a
Q12: The contingency table below shows the
Q14: A sports researcher is interested in
Q15: A random sample of 160 car
Q16: <span class="ql-formula" data-value="\text { The sampling distribution
Q17: In a test of independence, it
Q18: Inc. Technology reported the results of