Essay
In a comprehensive road test for new car models, one variable measured is the time it
takes the car to accelerate from 0 to 60 miles per hour. To model acceleration time, a
regression analysis is conducted on a random sample of 129 new cars. TIME60: = Elapsed time (in seconds) from to
MAX: Maximum speed attained (miles per hour)
The simple linear model was fit to the data. Computer printouts for the analysis are given below:
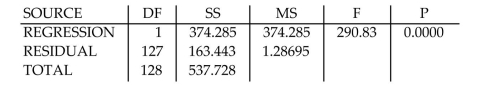
CASES INCLUDED 129 MISSING CASES 0
Correct Answer:

Verified
 . For every 1 mile per hour in...
View Answer
Unlock this answer now
Get Access to more Verified Answers free of charge
Correct Answer:
Verified
View Answer
Unlock this answer now
Get Access to more Verified Answers free of charge
Q67: Consider the data set shown below.
Q68: A large national bank charges local
Q69: The dean of the Business School
Q70: The equation for a (deterministic) straight
Q71: A <span class="ql-formula" data-value="95 \%"><span
Q73: A breeder of Thoroughbred horses wishes
Q74: A breeder of Thoroughbred horses wishes
Q75: An academic advisor wants to predict
Q76: The data for n = 25
Q77: To investigate the relationship between yield