Multiple Choice
The figure shows the graphs of the cost and revenue functions for a company that manufactures and sells binoculars. Use
the information in the figure to answer the question. 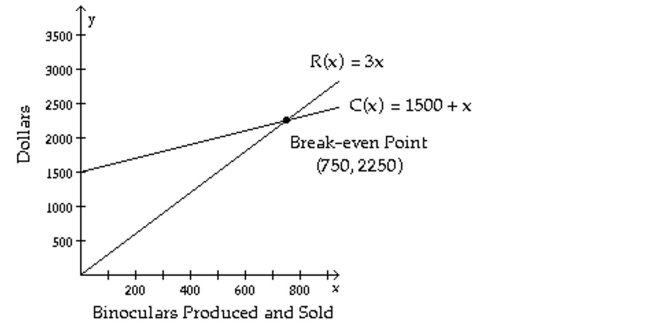
-At the break-even point both cost and revenue are what?
A) $2250
B) $1500
C) $750
D) $2700
Correct Answer:

Verified
Correct Answer:
Verified
Related Questions
Q129: Solve the system of equations by
Q130: Without graphing, decide:<br>(a) Are the graphs
Q131: Solve the system of equations by
Q132: Solve the system.<br>- <span class="ql-formula" data-value="\left\{
Q133: Solve.<br>-On a buying trip in Los
Q135: Is the ordered pair a solution
Q136: Solve the system of equations by
Q137: Without graphing, decide:<br>(a) Are the graphs
Q138: Determine whether the ordered pair is
Q139: Given the cost function, C(x), and