Multiple Choice
The figure shows the graphs of the cost and revenue functions for a company that manufactures and sells binoculars. Use
the information in the figure to answer the question. 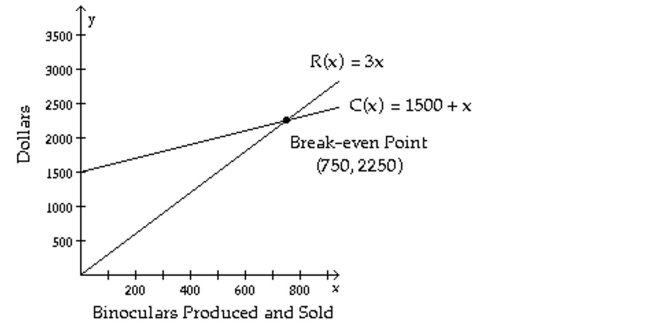
-Use the revenue and cost functions to write the profit function from producing and selling x binoculars.
A)
B)
C)
D)
Correct Answer:

Verified
Correct Answer:
Verified
Q35: Fill in the blank with one
Q36: Solve.<br>-Natasha rides her bike (at a constant
Q37: Solve the system of equations by
Q38: Solve the problem by writing and using
Q39: Solve the system.<br>- <span class="ql-formula" data-value="\left\{
Q41: Solve the system.<br>- <span class="ql-formula" data-value="\left\{
Q42: Solve.<br>-A certain aircraft can fly 912
Q43: Solve the system by the substitution
Q44: Solve.<br>-Dmitri needs 6 liters of a
Q45: Solve the system of equations by