Multiple Choice
The figure shows the graphs of the cost and revenue functions for a company that manufactures and sells binoculars. Use
the information in the figure to answer the question. 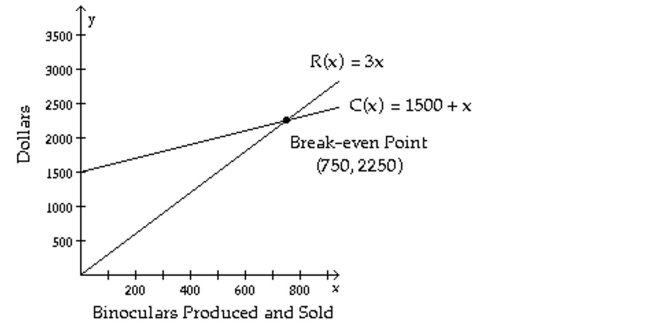
-What is the profit when 812 binoculars are produced?
A) $1748
B) $4748
C) $3124
D) $124
Correct Answer:

Verified
Correct Answer:
Verified
Q65: Determine whether the ordered pair is
Q66: Solve the system of equations by
Q67: Fill in the blank with one
Q68: Determine whether the ordered pair is
Q69: Solve.<br>-University Theater sold 513 tickets for
Q71: Solve the system.<br>- <span class="ql-formula" data-value="\left\{
Q72: Solve the system of equations by
Q73: Solve the system.<br>- <span class="ql-formula" data-value="\left\{
Q74: Solve the system.<br>- <span class="ql-formula" data-value="\left\{
Q75: Without graphing, decide:<br>(a) Are the graphs