Multiple Choice
The bar graph shows the number of tickets sold each week by the garden club for their annual flower show. Use the
graph to answer the question.
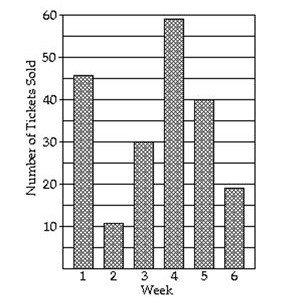
-During which week were the fewest number of tickets sold?
A) week 4
B) week 5
C) week 2
D) week 6
Correct Answer:

Verified
Correct Answer:
Verified
Related Questions
Q179: Solve. Assume the exercise describes a
Q180: Solve.<br>-A small-business research project estimated that for
Q181: Determine whether the relation is also
Q182: Graph the linear equation by finding
Q183: Determine whether the relation is also
Q185: Complete the ordered pair so that
Q186: Write an equation of the line
Q187: Complete the ordered pair so that
Q188: Provide an appropriate response.<br>-If <span
Q189: Fill in the blank with one