Multiple Choice
The bar graph shows the number of tickets sold each week by the garden club for their annual flower show. Use the
graph to answer the question.
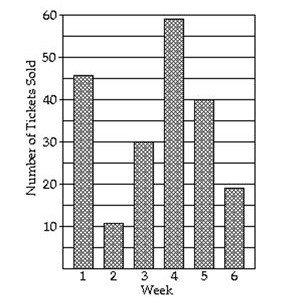
-During which week were 59 tickets sold?
A) week 6
B) week 4
C) week 5
D) week 1
Correct Answer:

Verified
Correct Answer:
Verified
Related Questions
Q136: Graph the linear equation by finding
Q137: Find an equation of the line.<br>-Perpendicular
Q138: Find the slopes of the lines
Q139: Find the slope of the line.<br>-<img src="https://d2lvgg3v3hfg70.cloudfront.net/TB4850/.jpg"
Q140: Determine whether the pair of lines
Q142: Graph the linear equation.<br>- <span class="ql-formula"
Q143: The bar graph shows the number
Q144: Determine whether the equation is a
Q145: Plot the ordered pair. State in
Q146: Find an equation of the line