Multiple Choice
The bar graph shows the expenditures of one city government in a recent year. Use the graph to answer the question. 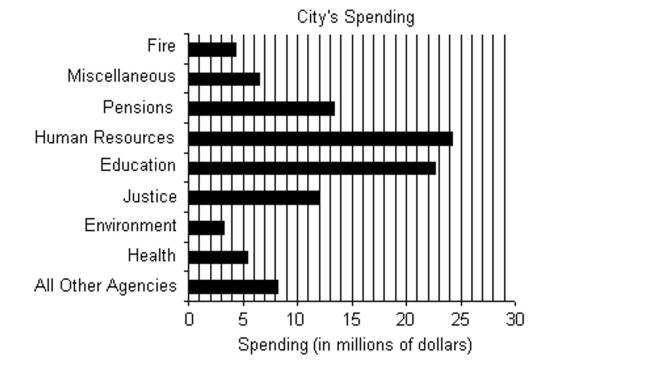
-Name the agency with the largest spending and estimate this value.
A) Human Resources; $24.2 million
B) Environment; million
C) Pensions; $13.4 million
D) Miscellaneous; million
Correct Answer:

Verified
Correct Answer:
Verified
Related Questions
Q60: Decide whether the equation describes a
Q61: Complete the ordered pair so that
Q62: The line graph shows the recorded
Q63: Find the slope of the line.<br>-x =
Q64: Find the slope of the line.<br>-
Q66: The bar graph shows the expenditures
Q67: Write an equation of the line
Q68: Fill in the blank with one
Q69: Decide whether the equation describes a
Q70: Graph the linear equation.<br>- <span class="ql-formula"