Multiple Choice
The circle graph below shows the number of pizzas consumed by college students in a typical month. Use the graph to
answer the question. 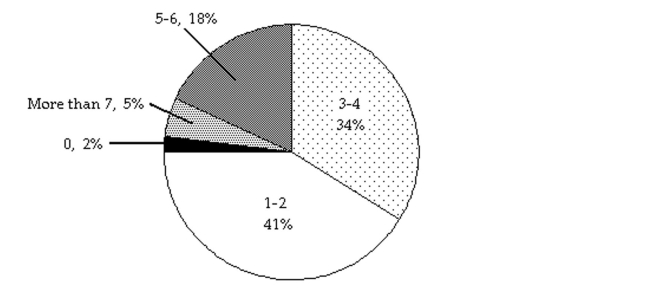
-If State University has approximately 28,000 students, about how many would you expect to consume 5-6 pizzas in a typical month?
A) 5040 students
B) 952 students
C) 504 students
D) 9520 students
Correct Answer:

Verified
Correct Answer:
Verified
Q206: Solve.<br>-Dave can hike on level ground
Q207: Solve.<br>-The perimeter of a triangle is 50
Q208: Graph the set of numbers given
Q209: Solve the inequality. Graph the solution
Q210: Solve.<br>-Claire has received scores of 85, 88,
Q212: Solve.<br>-A car rental agency advertised renting a
Q213: Solve the equation. Don't forget to first
Q214: Solve the equation.<br>-t - 8 = 14<br>A)
Q215: Solve. Round to one decimal place
Q216: Solve the equation.<br>--32.2 = -4.6c<br>A) 27.6<br>B) -27.6<br>C)