Multiple Choice
The circle graph below shows the number of pizzas consumed by college students in a typical month. Use the graph to
answer the question. 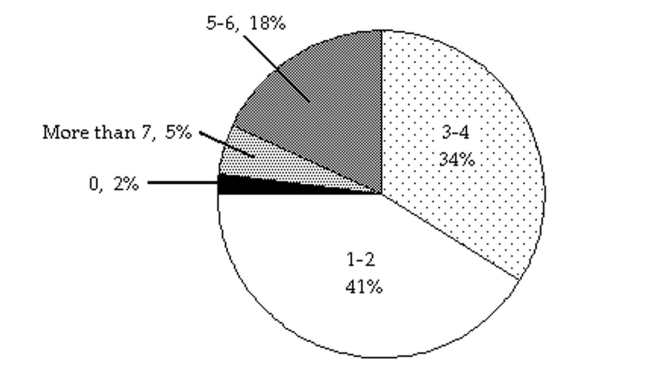
-If State University has approximately 29,000 students, about how many would you expect to consume 5-6 pizzas in a typical month?
A) 986 students
B) 9860 students
C) 522 students
D) 5220 students
Correct Answer:

Verified
Correct Answer:
Verified
Q29: Solve. If needed, round money amounts to
Q30: Fill in the blank with one of
Q31: Solve the inequality. Graph the solution
Q32: Substitute the given values into the
Q33: Identify the numerical coefficient of the
Q35: Write the following as an equation, using
Q36: Indicate whether the list of terms
Q37: Solve the problem.<br>-A convenience store employee is
Q38: Solve. Round to one decimal place
Q39: Identify the numerical coefficient of the