Multiple Choice
Solve the problem.
-The following graph shows data for a recent train ride from New York to Toronto. Find the rate of change of the distance from New York with respect to time, in miles per hour. 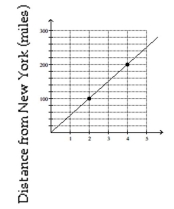
Time of Day (PM)
A) 40 miles per hour
B) 50 miles per hour
C) 100 miles per hour
D) 55 miles per hour
Correct Answer:

Verified
Correct Answer:
Verified
Q71: Find the coordinates of the y-intercept and
Q72: Graph the linear equation.<br>- <span class="ql-formula"
Q73: Graph the linear equation.<br>-y = 3x +
Q74: Find the coordinates of the y-intercept and
Q75: Find the coordinates of the y-intercept for
Q77: Find the coordinates of the y-intercept
Q78: List the quadrant(s)in which the given point
Q79: Show that the two ordered pairs are
Q80: List the quadrant(s)in which the given point
Q81: Plot the ordered pairs on the rectangular