Multiple Choice
Solve the problem.
-Data regarding the amount spent by a government department is represented in the following graph. Find the rate of change of the amount spent with respect to time, in billions per year. 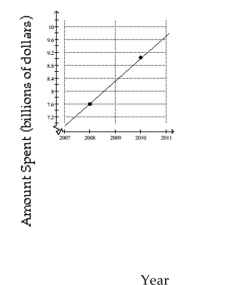
A) Increase of billion per year
B) Decrease of billion per year
C) Decrease of billion per year
D) Increase of billion per year
Correct Answer:

Verified
Correct Answer:
Verified
Q100: Show that the two ordered pairs are
Q101: Write the word or phrase that best
Q102: Write an equation for the graph.<br>-<img src="https://d2lvgg3v3hfg70.cloudfront.net/TB6465/.jpg"
Q103: Find the slope of the line
Q104: Find the x- and y-intercepts for
Q106: Find the coordinates of the y-intercept and
Q107: Find the slope of the line going
Q108: Find the slope of the line.<br>-<img
Q109: Graph the linear equation.<br>- <span class="ql-formula"
Q110: Show that the two ordered pairs