Multiple Choice
Solve the problem.
-The value of a particular computer system is represented in the following graph. Find the rate of change of the value of the computer system with respect to time, in dollars per year. 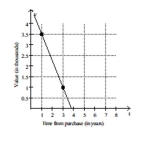
A) -$250 per year
B) -$500 per year
C) -$1250 per year
D) -$750 per year
Correct Answer:

Verified
Correct Answer:
Verified
Q113: Plot the ordered pairs on the rectangular
Q114: Find the coordinates of the y-intercept for
Q115: Find the slope of the line.<br>-<img
Q116: Find the slope of the line.<br><br>-
Q117: Find the coordinates of the y-intercept for
Q119: Show that the two ordered pairs
Q120: Solve the problem.<br>-Over one particular stretch of
Q121: Find the coordinates of the y-intercept and
Q122: Graph.<br>- <span class="ql-formula" data-value="x = -
Q123: Plot the ordered pairs on the