Multiple Choice
Solve the problem.
-The value of a particular car is represented in the following graph. Find the rate of change of the value of the car with respect to time, in dollars per year. 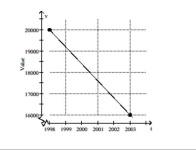
A) -$600 per year
B) -$700 per year
C) -$850 per year
D) -$800 per year
Correct Answer:

Verified
Correct Answer:
Verified
Q33: Find the coordinates of the y-intercept
Q34: Solve the problem.<br>-The value V, in dollars,
Q35: Graph the linear equation.<br>- <span class="ql-formula"
Q36: List the quadrant(s)in which the given point
Q37: Find the coordinates of the labeled points.<br>-<img
Q39: Determine whether the given ordered pair is
Q40: Find the coordinates of the y-intercept for
Q41: Plot the ordered pairs on the rectangular
Q42: Find the coordinates of the y-intercept
Q43: Plot the ordered pairs on the rectangular