Multiple Choice
The graph shows the enrollment at Riverside Community College for selected years. Use the coordinates of the given points to find the slope of the line. Interpret the meaning of the slope in the 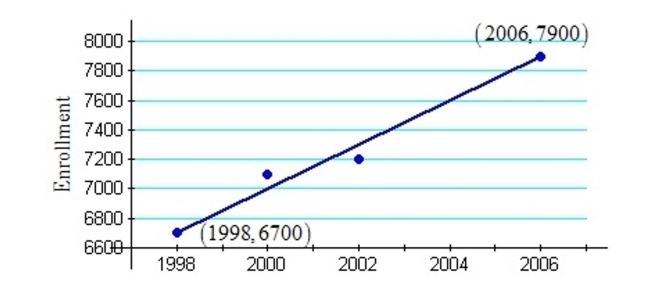 context of this problem
A) m = 300; Enrollment increases by approximately 300 students per year.
B) m = 150; Enrollment increases by an approximate factor of 150 students per year.
C) m = 300; Enrollment increases by an approximate factor of 300 students per year.
D) m = 150; Enrollment increases by approximately 150 students per year.
Correct Answer:

Verified
Correct Answer:
Verified
Q56: Find the domain and range of
Q57: Which relation is NOT a function?<br>A) {(7,
Q58: Determine the slope and the y-intercept of
Q59: At one college, a study found
Q60: Sketch a graph by completing the
Q62: Determine if the ordered pair is
Q63: Find the x-intercept and the y-intercept
Q64: Determine if the function is constant,
Q65: Find the x-intercept and the y-intercept
Q66: The slope of a line is