Multiple Choice
The following MINITAB output display presents the results of a hypothesis test for the difference between two population means.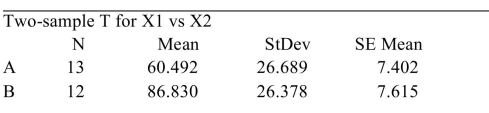
Difference
Estimate for difference:
CI for difference:
-Test of difference vs not T-Value
Value
How many degrees of freedom are there for the test statistic?
A) 22
B) 26.338
C) 23
D) 1.979112
Correct Answer:

Verified
Correct Answer:
Verified
Q40: In an agricultural experiment, the effects
Q41: Determine the value of <span
Q42: A marketing firm asked a random
Q43: Mauricio Cruz, a wine merchant for
Q44: Following is a sample of five
Q46: A researcher hypothesizes that the variation
Q47: The following MINITAB output display presents
Q48: When the subjects are paired or matched
Q49: In a random sample of 200
Q50: Two groups were polled about their attitudes