Multiple Choice
The following display from a TI-84 Plus calculator presents the results of a hypothesis test for a population proportion .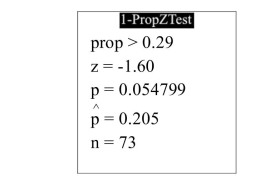
State the null and alternate hypotheses.
A)
B)
C)
D)
Correct Answer:

Verified
Correct Answer:
Verified
Related Questions
Q41: A fleet of rental cars -
Q42: <span class="ql-formula" data-value="\text { Is the statement
Q43: The probability of a type I
Q44: Which type of null hypothesis is
Q45: The power of a test measures the
Q47: In a simple random sample of
Q48: Find the critical value for the
Q49: Thirty-eight members of a bowling league
Q50: A recent survey indicated that the average
Q51: State whether the null hypothesis should