menu-iconExamlexExamLexServices

Discover

Ask a Question
  1. All Topics
  2. Topic
    Statistics
  3. Study Set
    Elementary Statistics Study Set 1
  4. Exam
    Exam 3: Data Description
  5. Question
    If a Distribution Is Negatively Skewed as Shown in the Figure
Solved

If a Distribution Is Negatively Skewed as Shown in the Figure

Question 112

Question 112

True/False

If a distribution is negatively skewed as shown in the figure below, the mean will fall to the right of the median and the mode will fall to the left of the median.
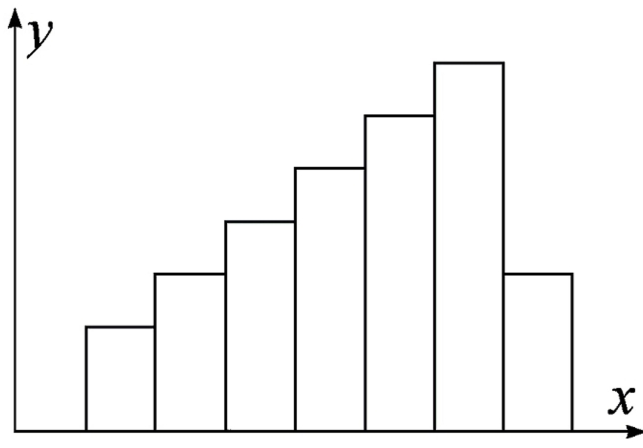
Correct Answer:

verifed

Verified

Unlock this answer now
Get Access to more Verified Answers free of charge

Related Questions

Q107: Given the following boxplot where

Q108: <span class="ql-formula" data-value="\begin{array}{l}\text { Approximate the population

Q109: For which of the following histograms is

Q110: The average weekly earnings in dollars for

Q111: Find the mean for the following data

Q113: Find the median for the following data.

Q114: What is the midrange of the following

Q115: Find the mean for the following data

Q116: <span class="ql-formula" data-value="\begin{array}{l}\text { For the data

Q117: Construct a boxplot for the data

Examlex

ExamLex

About UsContact UsPerks CenterHomeschoolingTest Prep

Work With Us

Campus RepresentativeInfluencers

Links

FaqPricingChrome Extension

Download The App

Get App StoreGet Google Play

Policies

Privacy PolicyTerms of ServiceHonor CodeCommunity Guidelines

Scan To Download

qr-code

Copyright © (2025) ExamLex LLC.

Privacy PolicyTerms Of ServiceHonor CodeCommunity Guidelines