Multiple Choice
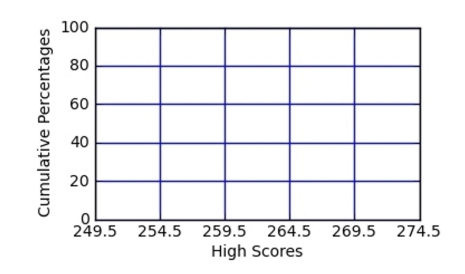
The data shown represents the high scores for members of a bowling league over a particular season. Find the approximate percentile rank of a score of 265 by constructing ; percentile graph.
A) 63
B) 60
C) 73
D) 69
Correct Answer:

Verified
Correct Answer:
Verified
Related Questions
Q61: A data set has a mean of
Q62: Find the mean of the following data
Q63: Gina and Stewart are surf-fishing on the
Q64: A random sample of weights (in
Q65: What is the range of the set
Q67: Find the mean for the following data
Q68: Find the sample standard deviation for the
Q69: Identify the five-number summary of the following
Q70: A five-number summary of a data
Q71: Make a boxplot for the following data