Multiple Choice
A sample of 200 high school students were asked how many hours per week they spend u television. The following frequency distribution presents the results.
Construct a frequency ogive for the frequency distribution.
A) 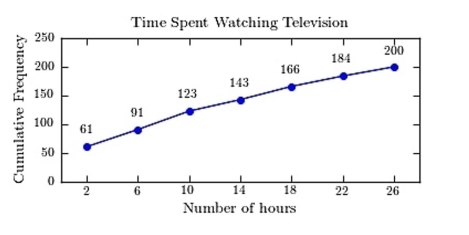
B) 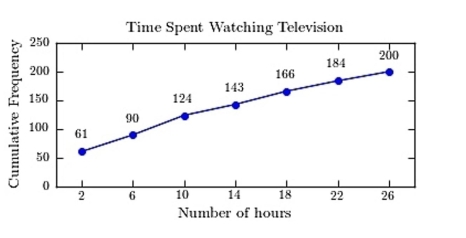
C) 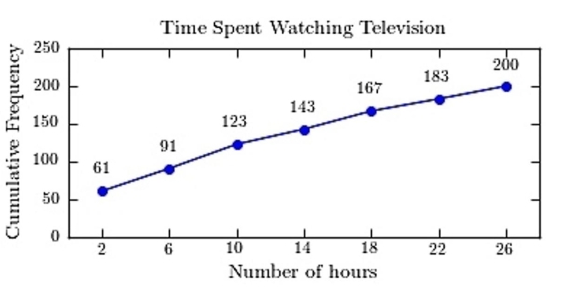
D) 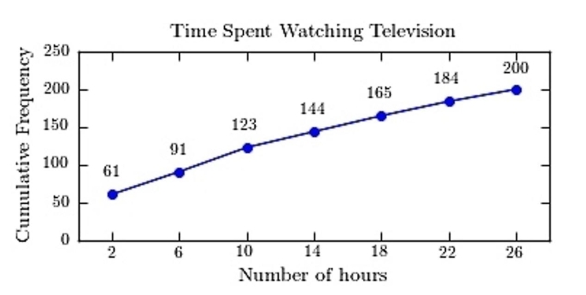
Correct Answer:

Verified
Correct Answer:
Verified
Q96: An automobile dealer wants to construct
Q97: The following frequency distribution presents the
Q98: <span class="ql-formula" data-value="\text { A pie graph
Q99: Which type of graph represents the data
Q100: Find the class boundaries, midpoint, and width
Q102: What is the lower class limit of
Q103: When making Pareto charts, data should be
Q104: If the graph of a frequency distribution
Q105: <span class="ql-formula" data-value="\begin{array}{l}\text { State the reason
Q106: The following table presents the purchase