Multiple Choice
Two students were asked to rate six different television shows on a scale from 1 to 10 points, with higher values ranking ahead of lower values. The data are shown in the follor table:
Which table shows the appropriate differences in the rankings needed in the computation the Spearman rank correlation coefficient?
A) 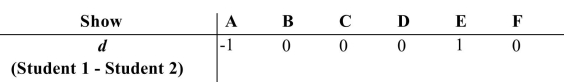
B)
C) 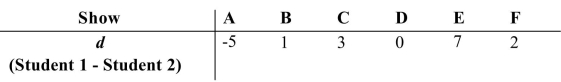
D) 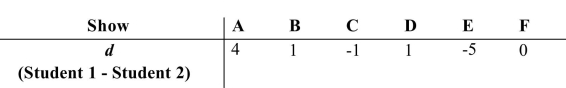
Correct Answer:

Verified
Correct Answer:
Verified
Q25: Two students rated, then ranked six
Q26: What is another term for nonparametric statistics?<br>A)
Q27: A professional golfer wanted to determine
Q28: Men and women were randomly selected
Q29: Nonparametric methods tend to use less information
Q31: A landscaping company hypothesizes that the
Q32: The following data was collected as
Q33: If a researcher is using the sign
Q34: Which of the following is not an
Q35: The is used to test a hypothesis