Multiple Choice
Which set of data represented by the three histograms below most likely came from a normal distribution?
A) 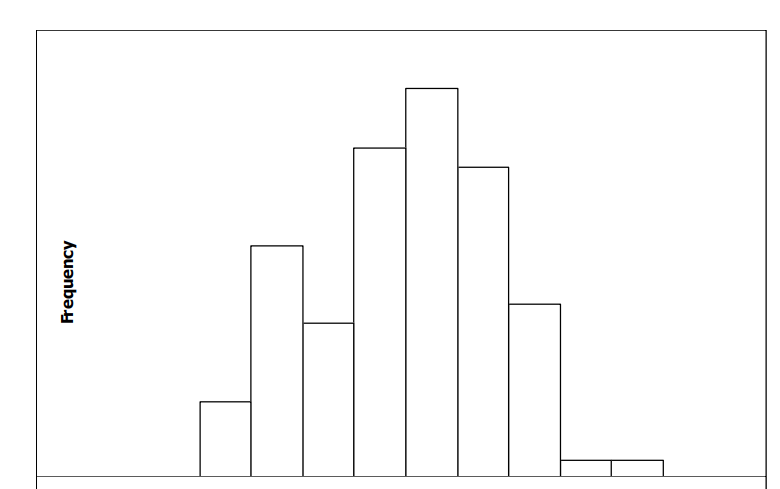
B) 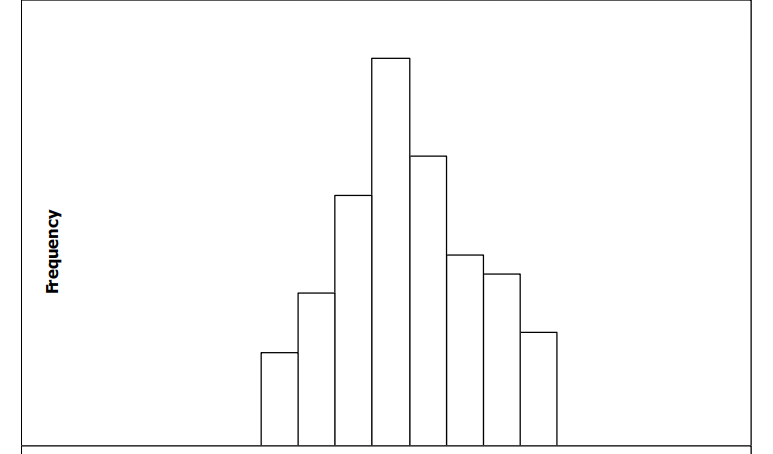
C) 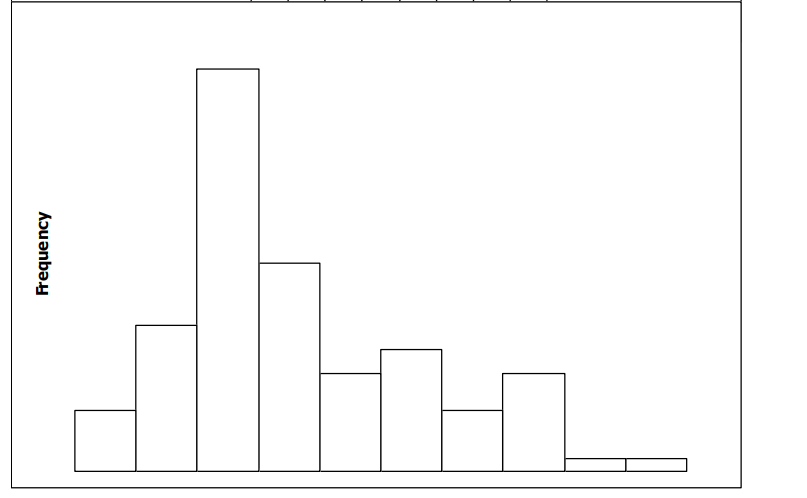
Correct Answer:

Verified
Correct Answer:
Verified
Related Questions
Q11: The mean score on the exit examination
Q12: Assume that women have heights that are
Q13: Apply the 68-95-99.7 rule to answer <br>-The
Q14: Many colleges require SAT scores of high
Q15: The lifetimes of light bulbs of a
Q17: The weights of the fish in a
Q18: The mean life of a set of
Q19: The scores on a certain test are
Q20: The weights of a large population of
Q21: Assuming that the lengths of the inchworms