Multiple Choice
using the graphical disply below.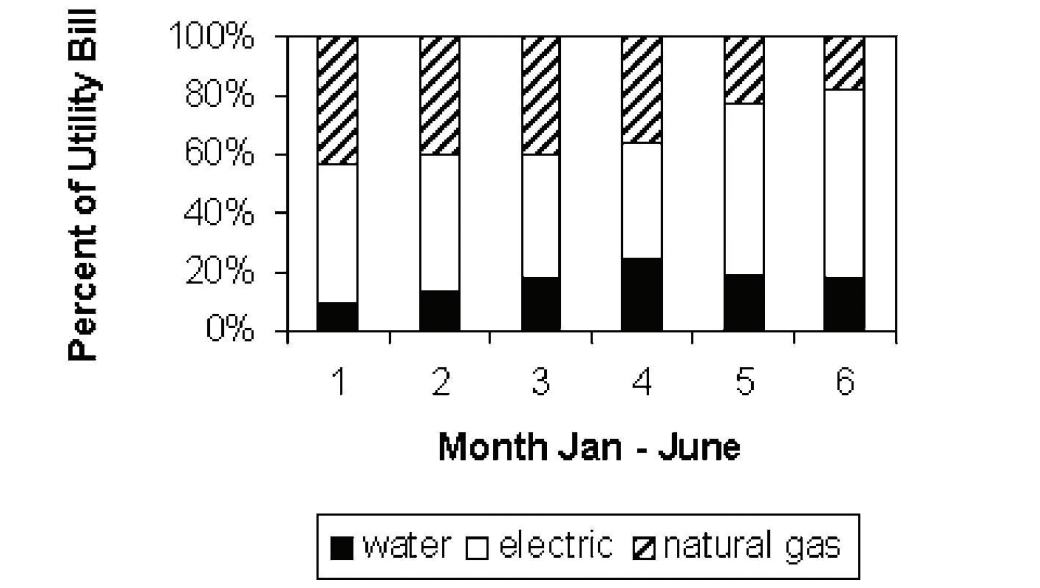
-Identify the utility that decreases as a percentage of the total utility bill from January to June.
A) Electric
B) Natural Gas
C) Water
D) None decrease from January to June.
Correct Answer:

Verified
Correct Answer:
Verified
Related Questions
Q8: A nurse measured the blood pressure of
Q9: <img src="https://d2lvgg3v3hfg70.cloudfront.net/TB2967/.jpg" alt=" - construct a
Q10: The Kappa Iota Sigma Fraternity polled its
Q11: Wagenlucht Ice Cream Company is always trying
Q12: The 47 businesses on four blocks
Q14: A nurse measured the blood pressure of
Q15: The stem-and-leaf diagram below shows the
Q16: Find the original data from the
Q17: A machine is supposed to fill
Q18: Construct a Pareto chart for the NCAA