Multiple Choice
Find the indicated z score. The graph depicts the standard normal distribution with mean 0 and standard deviation 1.
-Shaded area is 0.0694. 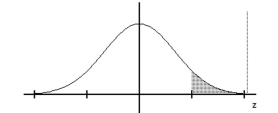
A) 1.48
B) 1.39
C) 1.45
D) 1.26
Correct Answer:

Verified
Correct Answer:
Verified
Related Questions
Q25: Assume that the weights of quarters are
Q26: Personal phone calls received in the last
Q27: If selecting samples of si
Q28: Scores on a test are normally distributed
Q30: Explain how a nonstandard normal distribution differs
Q31: For a standard normal distribution, find the
Q32: SAT verbal scores are normally distributed with
Q33: Examine the given data set and
Q34: For the binomial distribution with the
Q35: For women aged 18-24, systolic blood pressures