Multiple Choice
Find the area of the shaded region. The graph depicts the standard normal distribution with mean 0 and standard deviation 1.
-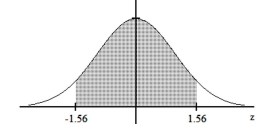
A) 0.1188
B) 0.8812
C) 0.0594
D) 0.9406
Correct Answer:

Verified
Correct Answer:
Verified
Related Questions
Q217: If z is a standard normal
Q218: The systolic blood pressures of the patients
Q219: The given values are discrete. Use the
Q220: Using the following uniform density curve, answer
Q221: The given values are discrete. Use the
Q222: Find the indicated z score. The graph
Q223: The weights of the fish in a
Q224: For the binomial distribution with the
Q225: The volumes of soda in quart soda
Q227: Assume that X has a normal