Multiple Choice
Find the indicated IQ score. The graph depicts IQ scores of adults, and those scores are normally distributed with a mean of 100 and a standard deviation of 15 (as on the Wechsler test) . 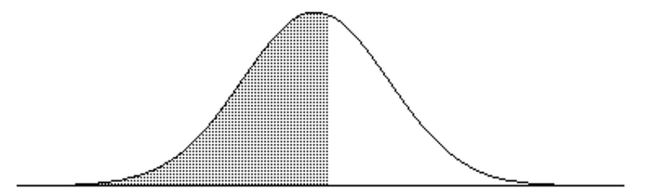 The shaded area under the curve is 0.5675.
A) 97.5
B) 110.7
C) 102.6
D) 129.6
Correct Answer:

Verified
Correct Answer:
Verified
Q65: Provide an appropriate response.<br>-Sketch a brief diagram
Q89: Provide an appropriate response.<br>-Explain why a continuity
Q91: Provide an appropriate response.<br>-According to data from
Q138: Using the following uniform density curve, answer
Q139: When sampling without replacement from a
Q142: Three randomly selected households are surveyed
Q144: For women aged <span class="ql-formula"
Q146: If z is a standard normal
Q147: Estimate the indicated probability by using the
Q148: The serum cholesterol levels for men in