Multiple Choice
Find the area of the shaded region. The graph depicts the standard normal distribution with mean 0 and standard
deviation 1.
-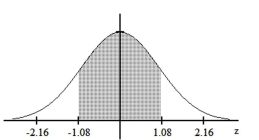
A) 0.7198
B) 0.1401
C) 0.2802
D) 0.8599
Correct Answer:

Verified
Correct Answer:
Verified
Related Questions
Q129: If z is a standard normal
Q130: Using the following uniform density curve, answer
Q132: The diameters of pencils produced by a
Q133: Examine the given data set and
Q135: The number of books sold over the
Q136: Use the normal distribution to approximate the
Q137: A final exam in Math 160 has
Q138: Using the following uniform density curve, answer
Q139: When sampling without replacement from a
Q142: In a certain population, 10% of people