Short Answer
Construct a modified boxplot for the data. Identify any outliers.
-The weights (in ounces) of 27 tomatoes are listed below.
A) Outliers: 1.7 oz, 4.2 oz
B) No outliers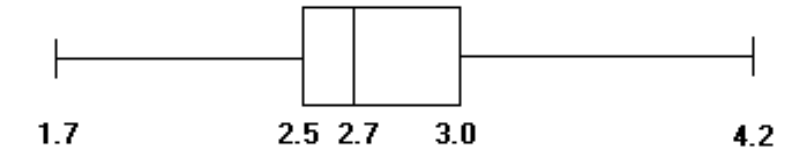
C) Outlier: 4.2 oz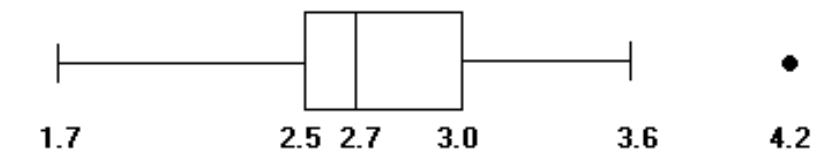
D) Outliers: 1.7 oz, 3.6 oz, 4.2 oz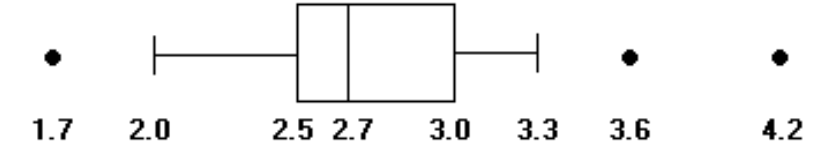
Correct Answer:

Verified
Correct Answer:
Verified
Related Questions
Q43: Find the mode(s) for the given
Q44: Skewness can be measured by Pearson's
Q45: Find the mode(s) for the given
Q47: In chemistry, the Kelvin scale is
Q49: The ages of the members of a
Q50: A store manager kept track of
Q51: Find the mean for the given
Q52: Provide an appropriate response.<br>-We want to compare
Q52: Find the variance for the given
Q53: Use the empirical rule to solve the