Short Answer
Construct a boxplot for the given data. Include values of the 5-number summary in all boxplots.
-The normal monthly precipitation (in inches) for August is listed for 20 different U.S. cities. Construct a boxplot for the data set.
A)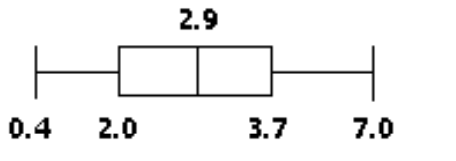
B)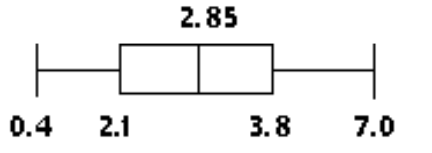
C)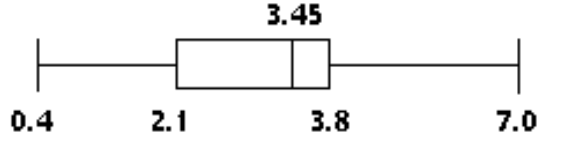
D)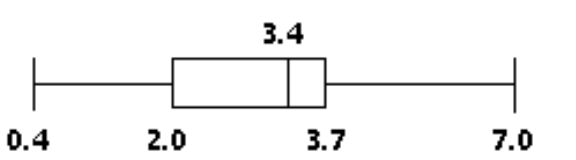
Correct Answer:

Verified
Correct Answer:
Verified
Related Questions
Q21: Provide an appropriate response.<br>-Describe how to find
Q67: Provide an appropriate response.<br>-The two most frequently
Q133: Find the midrange for the given
Q134: Listed below are the amounts of
Q135: Find the standard deviation for the
Q139: Find the mode(s) for the given
Q140: The test scores of 40 students
Q141: Find the midrange for the given
Q142: Find the median for the given
Q143: The heights of the adults in one