Short Answer
Construct a boxplot for the given data. Include values of the 5-number summary in all boxplots.
-The weights (in ounces) of 27 tomatoes are shown below. Construct a boxplot for the data set.
A)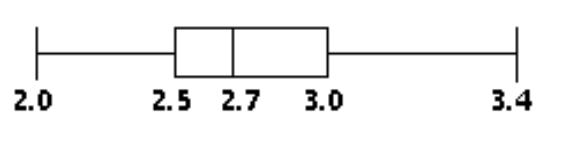
B)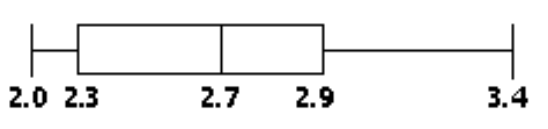
C)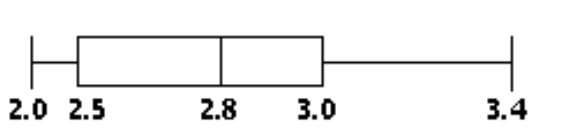
D)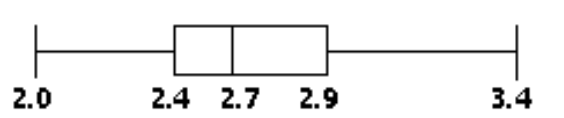
Correct Answer:

Verified
Correct Answer:
Verified
Related Questions
Q37: Provide an appropriate response.<br>-Boxplots are graphs that
Q142: Find the median for the given
Q143: The heights of the adults in one
Q144: Find the variance for the given
Q145: Construct a boxplot for the given
Q146: Determine which score corresponds to the higher
Q148: Responses to a survey question about eye
Q150: Listed below are the amounts of
Q151: The mean of a set of data
Q152: A student earned grades of C,